A break from the world cup posts today, because I’ve just come across an amusing website.
Correlation – or the lack of it – it one of the most interesting things we can find from statistics. For years, whether smoking causes cancer was ‘controversial’ but when the results of cancer cases versus smoking were plotted a direct correlation was found.
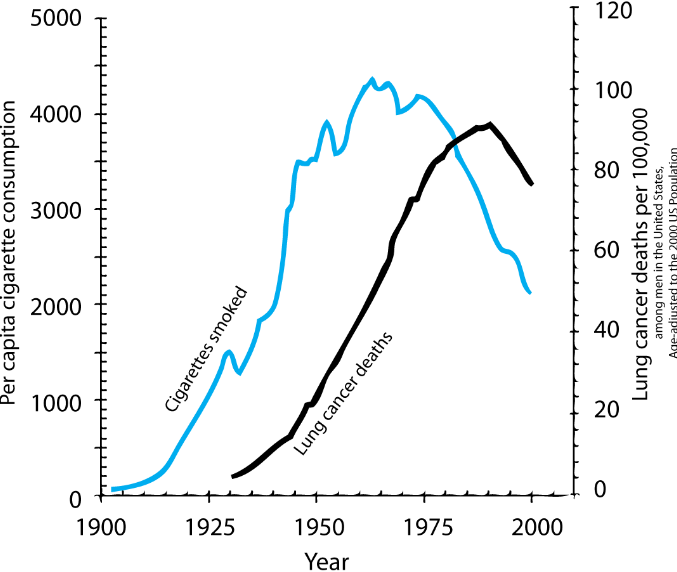
OK, so there is a small lag in time, but that is explainable..
And that is the point about correlation on a graph. A pattern we can see only means two things are ‘correlated’ if we can explain why that connection might exist.
Its an important lesson in how Statistics must be handled!
And that brings me back to the amusing website, which gives a few comical examples where it LOOKS like there is a connection…. but can there be, really?
Here is an example!
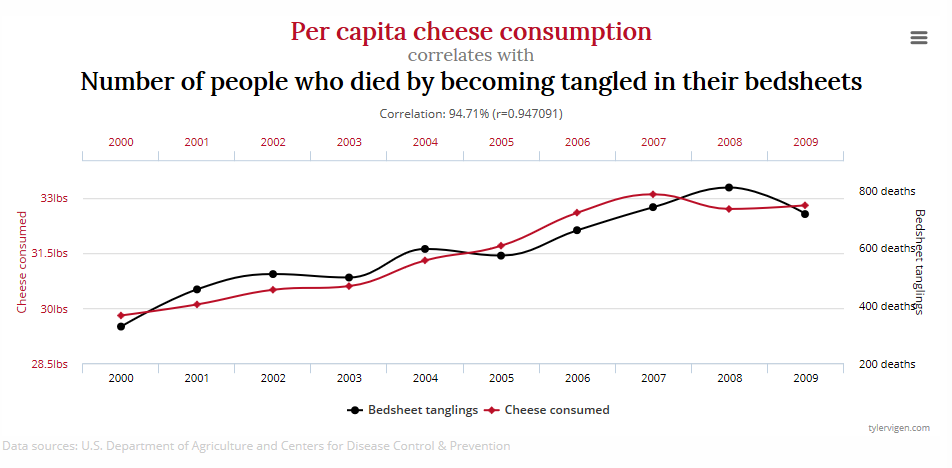
And here is a link to some more!
http://www.tylervigen.com/spurious-correlations