Home » Archives for June 2018

Month: June 2018

Rules for spotting factors

We often need to spot the factors for a higher number. How can we do this without doing the division sums?

For some numbers, its easy to spot. How can you tell if 5 is a factor of your number?

That’s easy. If the last digit of the number is a 0 or 5, then 5 is a factor. If it doesn’t, then 5 is not a factor

5 is a factor of 670 and 1225. It is not a factor of 234 or 1352.

Is 2 a factor? That’s easy in a similar way. The last digit needs to be a 0, 2, 4, 6 or 8.  The even numbers, of course. 2 is a factor of even numbers. Its not a factor of odd numbers.

Is 3 a factor?  Or 9?  For these possible factors we don’t just look at the last digit, but we add up all the digits in the number. If they come to a known multiple of 3, then 3 is a factor. If they come to a known factor of 9 then 9 is a factor.

So 4524 – add up the digits  4 + 5 + 2 + 4 = 15 – 15 is 3 x 5 so 3 is a factor of 4524, but 9 is not.

But 4527  4 + 5 + 2 + 7 = 18  and 9 is a factor of 18, so it is also a factor of 4527.

Note the pattern also holds for 15 and 18 – I used our knowledge of 3 x 5 = 15 and 2 x 9 = 18 above,  but also 1 + 5 = 6 and 1 + 8 = 9.


How do I know if 6 is a factor?  Use both rules above.  If 2 is a factor and 3 is a factor, then so is 6.

What can we really tell from a graph?

A break from the world cup posts today, because I’ve just come across an amusing website.

Correlation – or the lack of it – it one of the most interesting things we can find from statistics.  For years, whether smoking causes cancer was ‘controversial’ but when the results of cancer cases versus smoking were plotted a direct correlation was found.

OK, so there is a small lag in time, but that is explainable..


And that is the point about correlation on a graph. A pattern we can see only means two things are ‘correlated’ if we can explain why that connection might exist.

Its an important lesson in how Statistics must be handled!

And that brings me back to the amusing website, which gives a few comical examples where it LOOKS like there is a connection….   but can there be, really?

Here is an example!


And here is a link to some more!

http://www.tylervigen.com/spurious-correlations


World Cup Time! – How big is a football Pitch

People may be surprised to know there is no fixed size for a football pitch, just a range

The length of the pitch must be between 90m and 120m, the width must be between 45m and 90m. For some reason a bit of trivia I remember from my childhood is that Doncaster Rovers had the widest pitch – (That quite probably isn’t true now as they moved grounds)

Oh and one other restriction is that a pitch can’t be square – 90m x 90m is not allowed.

Question – In percentage terms how much bigger than the smallest pitch can the largest pitch be?

On these figures, the smallest pitch would be 90m x 45m = 4050m2

The largest pitch could be 120m x 90m = 10800m2

So the largest pitch could be 166% larger than the smallest pitch!


In reality that doesn’t happen, the pitch sizes in the Premier League last year ranged from 7140m2 at Bournemouth    to 6400m2 at Stoke City.

World Cup Time! – Kaliningrad

For the next few posts I’m going to post about Maths and the world cup , and from some of the countries competing. Today its not on one on the countries, but one of the cities where matches are taking place.

Kalilingrad, where England play Belgium is in a part of Russia now separate from the rest of the country but it used to be a German City called Konigsberg.  The city is built on the River Pregel, which flows through the city leaving a number of islands. In the 18th Century there were 7 bridges across the river, like this

The citizens of Konigsberg liked to challenge visitors with the following task – Can you walk around the city, starting and finishing at the same point  and cross each bridge only once. No body was able to do this, but neither could anybody show that it was impossible.

The the Swiss mathematician Euler got involved – and more of him when I get to Switzerland. He showed that by simplifying the map to just dots and lines, it could be shown that it was impossible, and with that started a whole new branch of mathematics called Network Theory, which later became part of the whole new area of Topology.  All because the people of Konigsberg liked to challenge their visitors

What Euler did first was that Euler draw the map as lines and dots, removing the ‘Cityness’ of the map. This is a normal thing to do in ‘mathematical Modelling’ – Strip what he have down to the basics

I won’t use all his mathematical language here but you might see the sense of what he said.  Each point has a number of lines and Euler called this the ‘order’. He showed that to be sure of being able to do the walk, all the points needed an even number of lines. He also showed that you can have two points with an odd number, just so long as you didn’t want to get back to where you started (and started at one of the ‘odd’ number points.

Why not draw some of your own diagrams and check this rule out?

Are GCSE’s getting harder – An answer

OK so that title is misleading. I am not going to say if I think for sure GCSEs are getting harder, though I do think the maths exams of the last couple of years are making more demands of Students.

But I will give the answer to the question I posted two days ago.


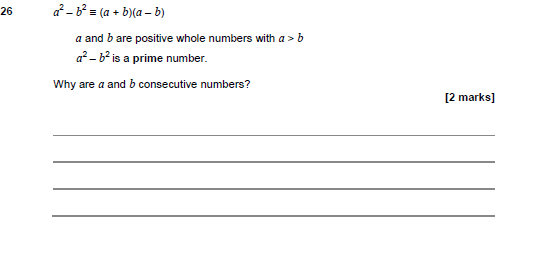
I think what is interesting about this question is that its unlikely the student has seen a question quite like this before.


Its hard to know how to prepare for the question. What it is looking for is a ‘feel’ for the situation. I think the new 9-1 exams are designed so that this ‘feel’ is required to get top grades.

So how do we answer it?  Well, we are given the common factorisation of a2 – b2.   We are told for the values of a and b this is a prime number.

But we also are given a multiply sum (a + b)(a – b) with this as the answer.  And what is the only multiply sum that has a given prime number p as the answer?

Its p x 1 !   So either a + b = 1 or a – b = 1.  A + b can’t = 1 because we can’t have two positive whole numbers adding up to 1.

so a – b = 1,  or a = b + 1. In other words they are consecutive numbers, as the question says.

And that’s it – It is only two marks after all. A knowledge of what prime numbers are, but in an unfamiliar context, is what is required for these marks.

And that’s what I mean by, an ability, a confidence, of recognising skills and facts learnt when seen in unfamiliar surroundings is what is required to get an 8 or 9 in the new GCSE. It will reward true understanding.


Are GCSE’s getting harder?

That’s a rather open question! And to be honest, I’m not going to give a full analysis here, and certainly not across all subjects!

But I have noticed in recent GCSE exams, more is being asked of the student than just applying the maths they have learnt in the class room.

All exams still have a number of what I call ‘Book Questions’ – ones where the student who has studied their coursework well should be able to answer – Solve an equation, read information from a graph.

There are also ‘Problem solving’ questions – Work out the numbers for a specific situation. These do require planning the work and  sometimes drawing knowledge from different parts of the syllabus. Though more challenging, questions like this have appeared on exams for years.

The more challenging questions I have noticed on recent exams ask for a critical input from the student. These questions reward more than just book learning – Really being at ease with the subject is needed.

This is a question from the higher paper and two things to note – Its question 26 so its from the later part of the exam, and its only worth 2 marks.

This means there shouldn’t be a lot of work involved, but its aimed at the more able student.  Leaving those two things with you, I’ll give a solution tomorrow!